
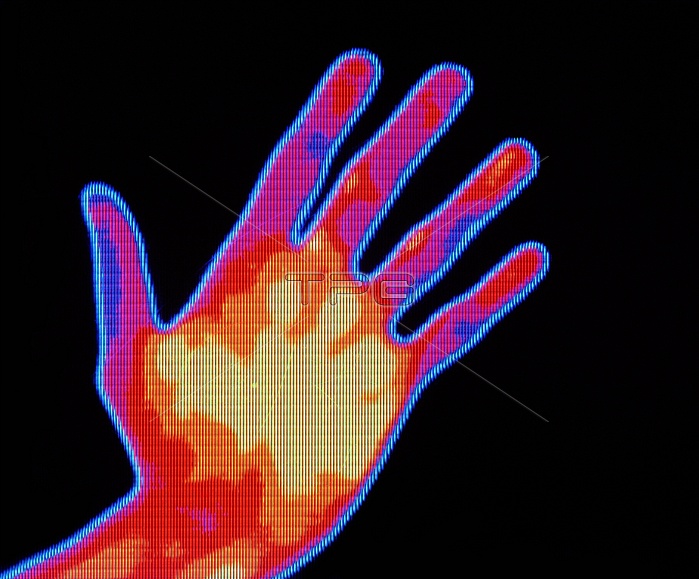
Thermogram of the hand of a non-smoker, showing the temperature distribution associated with a healthy blood circulation (see M370/225 for comparison). Thermography is an imaging technique for mapping the heat distribution over the surface of a body. Here, the colour-coded image shows temperature variation in 0.1 degree celsius steps (see scale at left), where blue corresponds to the colder areas and yellow corresponds to the hotter areas. Thermography can provide clues to the presence of diseases and abnormalities that alter the temperature of the skin, such as circulatory problems, inflammation, and tumours.
| px | px | dpi | = | cm | x | cm | = | MB |
Details
Creative#:
TOP10203269
Source:
達志影像
Authorization Type:
RM
Release Information:
須由TPG 完整授權
Model Release:
N/A
Property Release:
N/A
Right to Privacy:
No
Same folder images:
 Loading