
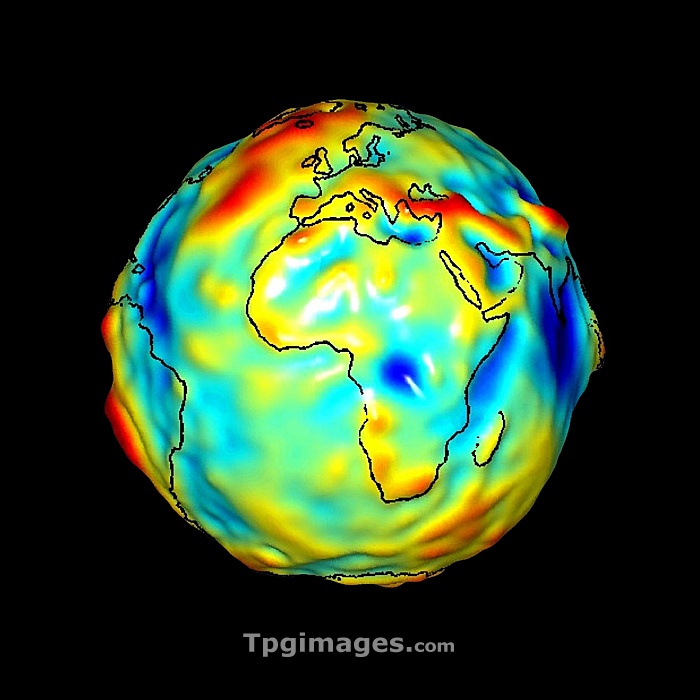
Gravity map of Earth. Computer model showing the variation of the Earth's gravity field centred on Africa and Europe. Colours represent gravity anomaly. These are the differences between the theoretical value for the gravity at the surface, if the Earth was a perfectly smooth ellipsoid, and the actual measured value. They range from blue (low gravity), through green, yellow, orange and red (high gravity). This model was created from data acquired by NASA's Gravity Recovery and Climate Experiment (GRACE). An accurate gravity map enables scientists to better understand the Earth's internal structure and may help predict climate change and natural hazards.
| px | px | dpi | = | cm | x | cm | = | MB |
Details
Creative#:
TOP07420204
Source:
達志影像
Authorization Type:
RM
Release Information:
須由TPG 完整授權
Model Release:
NO
Property Release:
NO
Right to Privacy:
No
Same folder images:
 Loading